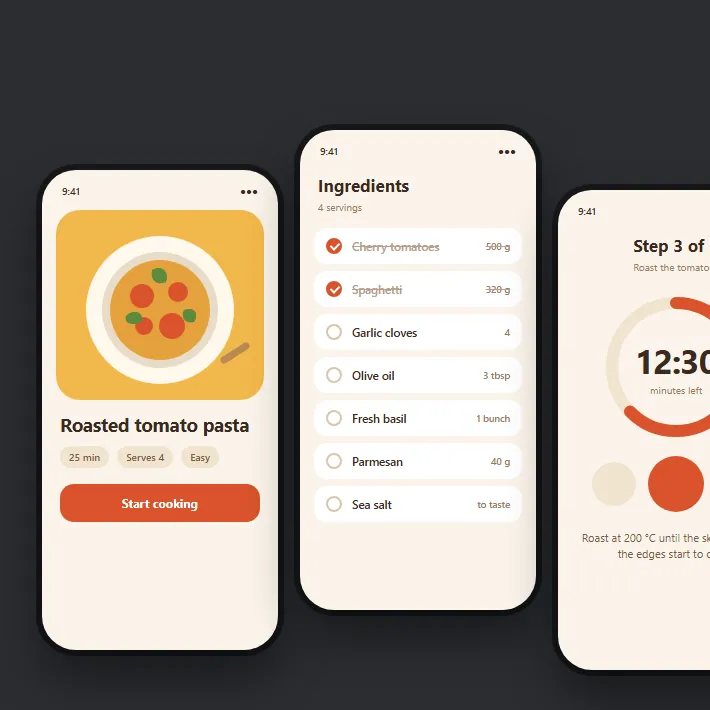
Northwind Labs makes software that tracks how people use websites. Their customers are small teams, not analysts, and the old dashboard buried the few numbers those teams actually check.
I redesigned the main screen around four key figures and one chart, then built it in React with charts drawn as plain SVG. It loads quickly and stays sharp on any screen.
The brief
The team wanted a dashboard a marketing manager could understand without training. Fewer panels, clearer numbers, and a chart that shows whether things are going up or down without squinting.
What I built
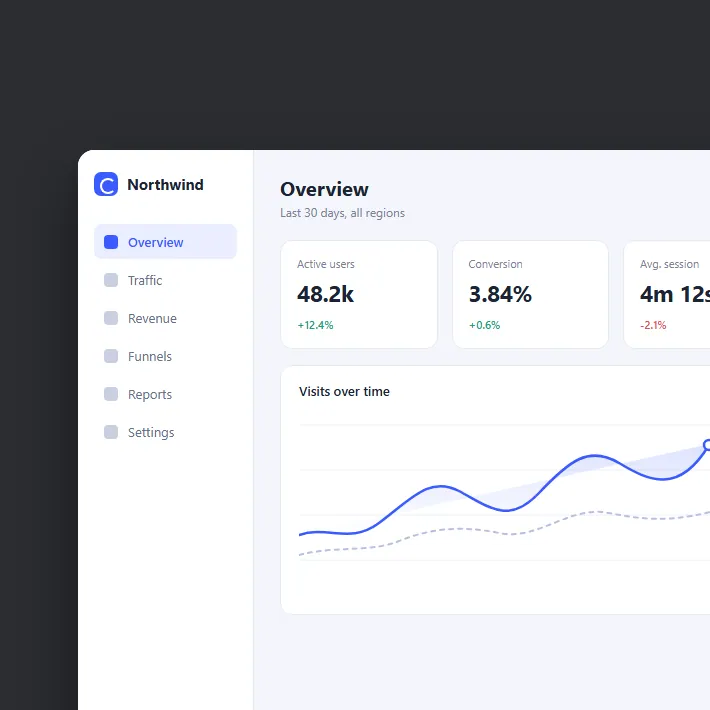
The overview screen has a slim sidebar and four tiles: active users, conversion, session length and revenue. Each tile shows one figure and how it changed since last month, in green or red.
Under the tiles sits a single line chart with the previous period as a dotted line behind it. I drew the charts as SVG by hand instead of adding a charting library, which kept the page small and let me match the type and colours exactly.
Date ranges, filters and the other report pages reuse the same few components, so new screens take days rather than weeks.